Process Improvement - Progress by User Story and Count of User Story
(Metric) for Tier: Governance
Organizational Goal
Close gaps on key CMMI, DMM, SVC and CMMC activities in order to continually improve our capabilities.
Quantitative Goal
Deploy 80% high priority process improvement User Stories within performance period.
Visual Display of Measure
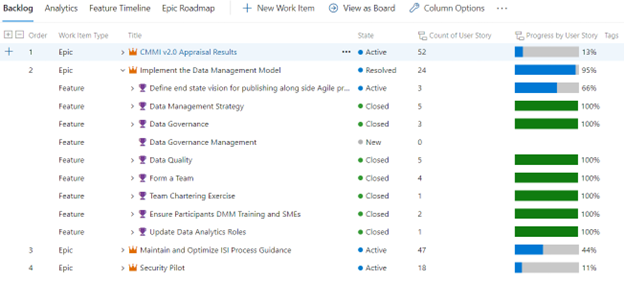
Metric Description
The “Progress by User Story” metric displays the percentage of associated descendant work items that have been completed or closed.
The “Count of User Story” metric displays the sum of descendant items. Totals provide a measure of the size of a Feature or Epic based on the number of its child items.
Collection Method, Frequency and Storage
Progress by User Story:
Each User Story is Closed as Completed by process team member upon integration to Main code branch. Azure Dev Ops collects all data related to this metric.
Count of User Story:
Each User Story is added by the process team member and linked as a child to appropriate Feature work item. Features are linked as a child to appropriate Epic work item.
Data Integrity
- Progress by User Story:
Implement Process Improvement activity is where the User Stories are Closed.
Process Lead and Process Engineers will monitor completion of User Stories including:
- Tracking completion of appropriate user stories by ensuring only solutions that are developed, peer reviewed, verified and integrated into main code branch are closed.
Process Improvement Team Status
- Scrum Master checks status, ensures work items are in correct board column, removes roadblocks.
- Count of User Story:
Identify Improvement Opportunities activity is where the User Stories are created.
Process Lead and Process Engineers will monitor creation of User Stories including:
- Identifying user stories out of scope and closing as needed
- Identifying additional required user stories and creating as needed
Analysis Method
Review the roll up data for high priority work to determine completeness of process development work. Compare the User Story count against the “Progress by User Story” percentage. Depending on percentages specific action should be taken. Consider the following when performing analysis: High User Story Count and Low User Story Progress Percentage:
0% - 25%
- Analyze backlog to determine it is complete and represents only items that are high priority. Consider splitting out items, closing or deferring. Lowering the priority is also viable solution to present to team and executives.
- Ensure resources are fully committed and available. Determine if stakeholders available to develop solutions are able to perform their work. It may be necessary to find additional resources or swap out subject matter expert.
- Ensure resources have needed skills to develop process. It may be necessary to gather training needs or swap subject matter expert.
Note
Always consider period of performance deadlines when performing analysis.
Reporting Distribution and Frequency
See InnovaSystem’s Process Guidance RA for the following activities to determine which roles are included in the communication of the measurement data:
USED IN
SEE ALSO
Process Guidance Version: 10.4