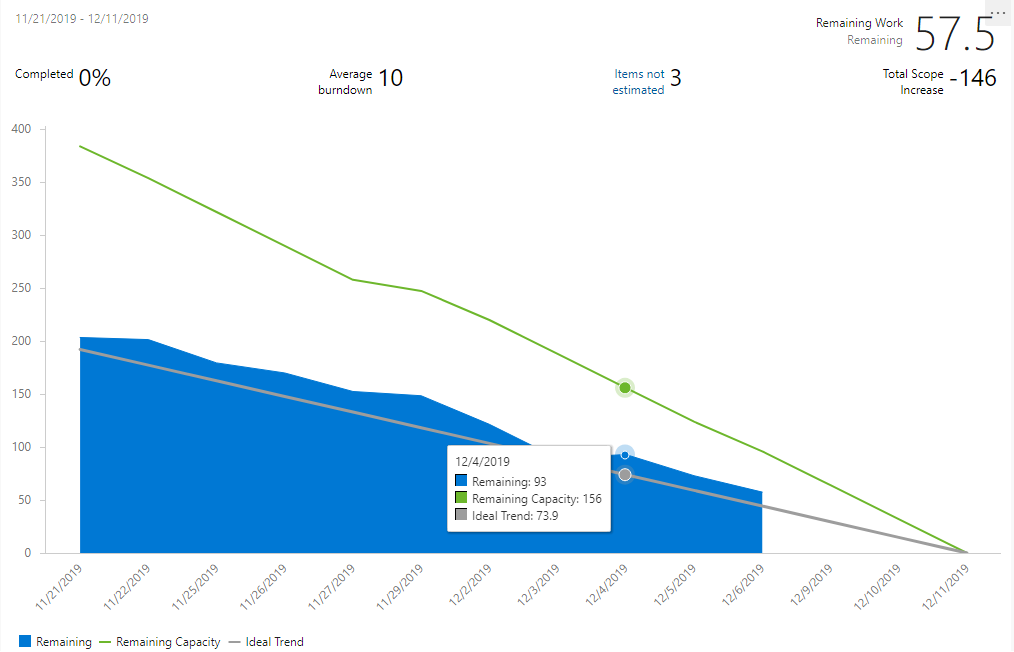
Sprint Burndown Chart
(Metric) for Tier: Sprint
Organizational Goal
Performance: Ensure sprints are planned, communicated and executed.
Quantitative Goal
The ideal trend burndown rate of remaining work within a 20% variance by the end of the sprint.
Visual Display of Measure
Metric Description
The Burndown Chart shows the remaining work for the sprint, how much scope was added, and an estimate of when remaining work will be completed.
The Burndown Chart is created by plotting the remaining work hours from the sprint against the remaining team capacity.
- X axis to display working days
- Y axis to display remaining effort
- Ideal effort as a guideline
- Team capacity as a guideline
- Remaining work as an area chart
- Total remaining work, time, for all sprint tasks against:
- Ideal Trend: The trend line as the rate by which planned remaining work needs to decrease to reach zero by the sprint end date to ensure schedule completion.
- Available Capacity: The line as the rate by which the available capacity decreases during sprint execution, automatically calculated from sprint capacity.
- Remaining Work: The area chart as the rate by which the remaining work decreases.
Collection Method, Frequency and Storage
Each member of the development team is responsible for updating their work item hours daily in Azure DevOps. Completed work should increase for effort spent on the task. Remaining work should reflect the actual work left on the task and be independent of the competed work and original estimate. Azure DevOps will re-calculate the visual in near real time so changes to work item hours can be made multiple times a day but at a minimum should be update daily.
Data Integrity
Initial values of for work item hours should be set by sprint planning and then updated continuously throughout the sprint activities. During the daily stand up work item hours should be reviewed and optionally corrected as part of reporting status along with reviewing the sprint burn down.
Analysis Method
Review the remaining work area chart to determine if all the remaining work will be completed by the end of the sprint. The ideal trend line shows if the team is ahead or behind the average amount of hours needed to complete work by the end of the sprint. The sprint capacity line shows if there is more work remaining than the teams planned capacity. Look for the following conditions in the sprint burndown chart to determine if more analysis is required.
Areas where the remaining work flattens out or rises compared to the capacity line
- this may indicate that work is blocked, additional work was identified, work item hours haven’t been updated, an event that reduced sprint capacity wasn’t recorded
Areas where the remaining work drops sharply compared to the capacity line or ideal trend line
- this may indicate that work item hours were updated late, that tasks were overestimated and remaining work wasn’t accurate,
Areas where the remaining work gets within 10% of or higher than team capacity
- this may indicate that the team may need additional effort to complete all work in the sprint, the team should ensure that remaining work is accurate, the team should review the sprint backlog priority to ensure highest priority work is done first, the team may need to remove items from the sprint and inform stakeholders
Note
Azure DevOps should automatically remove or indicate weekends and other capacity days off
Reporting Distribution and Frequency
See InnovaSystem’s Process Guidance RA for the following activities to determine which roles are included in the communication of the measurement data: