Code Review Quality Analysis for a Release
(Metric) for Tier: Release
Organizational Goal
Improve the Code Review process and overall product quality between releases.
Quantitative Goal
Analyze and correlate trends between SonarQube activities and Pull Request tags for a release to ensure that the Code Review Maturity level is stable or improving.
Visual Display of Measure
Todo
Add Image from completed pull requests with tags
Metric Description
Review the SonarQube activities for the release related to issues, coverage, complexity, and maintainability to evaluate regressions to quality and correspond that with matching pull request tags during the release. Review the list of completed pull requests for the release targeted to the teams CI branch for the pull request tags. Compare the tags or lack of tags to the corresponding activity in SonarQube to understand where the Pull Request didn’t tag the issue or missed the issue and the activity deteriorated. Determine the team maturity level for preforming code reviews according to the defined levels. Preform Root Cause Analysis on data irregularities and team maturity level to support creating action items to improve Code Reviews and overall product quality. Minimum thresholds for data elements can be customized per repository to meet achievable goals and defined in team procedures for Continuous integration or in the Product Integration Plan.
| SonarQube Activities | Pull Request Tag |
|---|---|
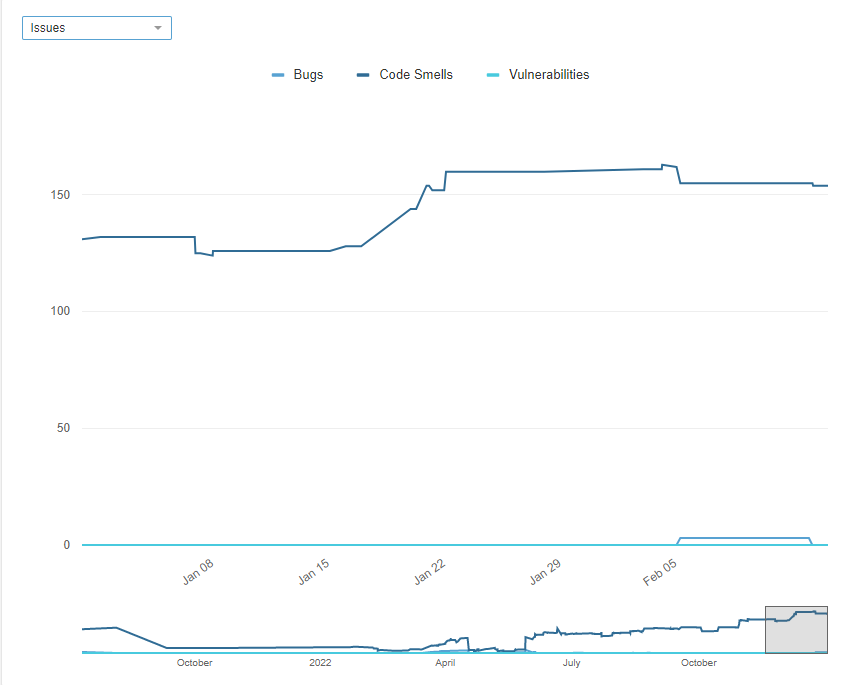
| Issues | Bugs |
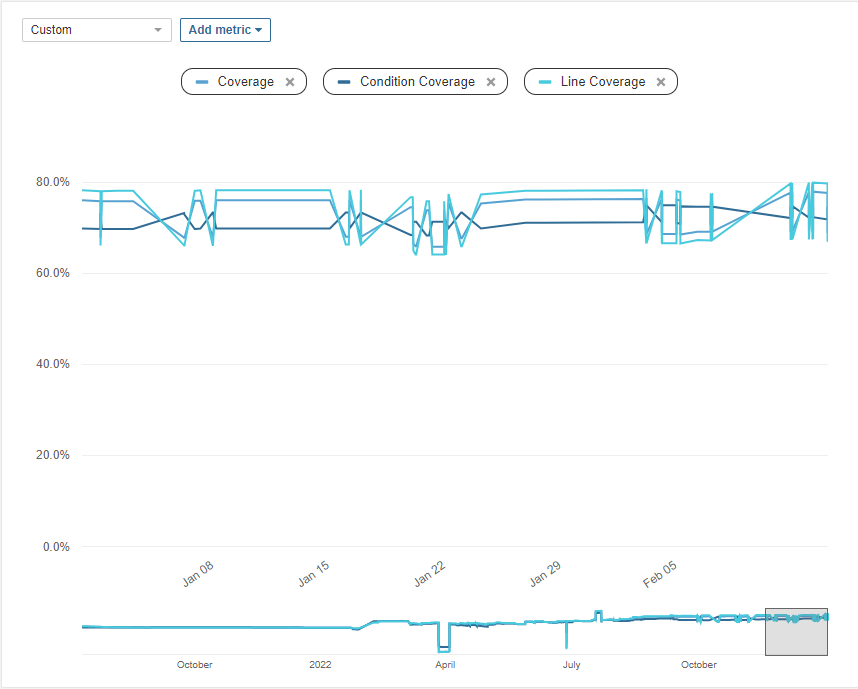
| Custom with Coverage, Line Coverage, Condition Coverage(if available) | Test |
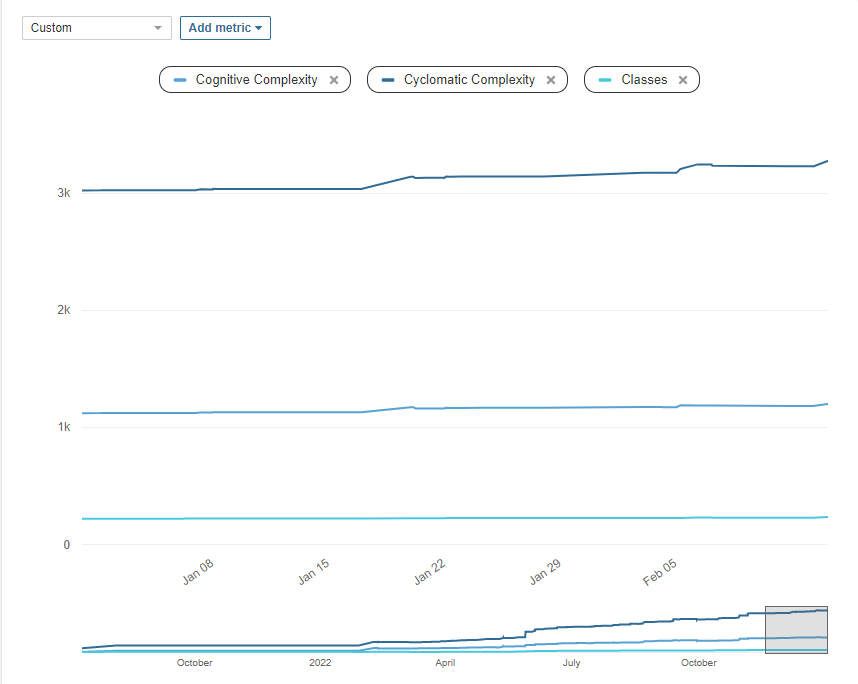
| Custom with Cognitive Complexity, Cyclomatic Complexity, Classes | Complexity |
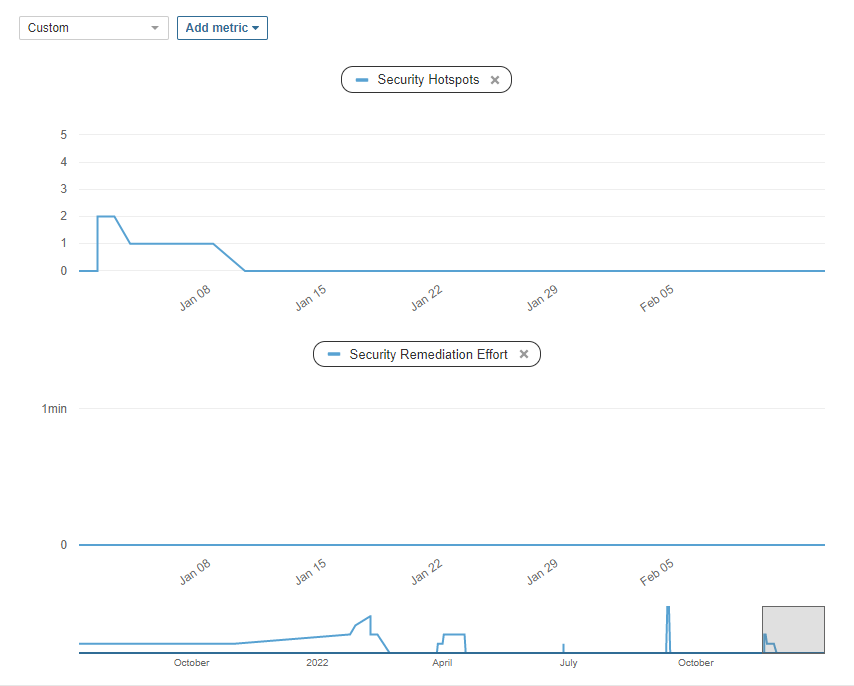
| Custom with Security Hotspots, Security Remediation Effort | Security |
| SonarQube Element | Element Interpretation | Element Description |
|---|---|---|
| Bugs | Fewer is better | An issue that represents something wrong in the code. |
| Code Smells | Fewer is better | A maintainability-related issue in the code. |
| Vulnerabilities | Fewer is better | A security-related issue that represents a backdoor for attackers. |
| Coverage | 100% is best, 80% minimum threshold | A mix of Line coverage and Condition coverage. |
| Condition Coverage | 100% is best, 80% minimum threshold | The percentage of code conditions tested. |
| Line Coverage | 100% is best, 80% minimum threshold | The percentage of lines of code tested. |
| Cognitive Complexity | Fewer is better | How hard it is to understand the code’s control flow. |
| Cyclomatic Complexity | Fewer is better | A quantitative metric used to calculate the number of paths through the code. |
| Classes | Fewer is better increases should accompany additional functionality | The number of classes (including nested classes, interfaces, enums, and annotations). |
| Security Hotspots | Fewer is better | The number of Security Hotspots |
| Security Hotspots Reviewed | 100% is better, 80% minimum threshold | The percentage of reviewed security hotspots. |
- Code Review Maturity Levels
- Level 1
- SonarQube Activities have Element regression
- Zero or low amount of corresponding pull request tags
- Level 2
- SonarQube Activities have element regression or remain stable
- Corresponding pull request tags
- Level 3
- SonarQube Activities have element improvements
- Corresponding pull request tags
- Level 4
- SonarQube Activities have element improvement or have reached a quality equilibrium
- Zero or low amount of corresponding pull request tags
Collection Method, Frequency and Storage
- Code Reviewers will tag Pull Request for identified issues as defined in the Review Code activity, Azure DevOps will record and display the pull request tags.
- The Build Engineer is responsible for ensuring Continuous Integration scans the code and pushes the result in SonarQube as defined in their Continuous Integration schedule, SonarQube will record and display the data.
- Project Managers are responsible for taking a screen shot of each of the SonarQube Activities defined above for each Git repository with changes for the current and previous release.
- Project Managers are responsible for taking a screen shot of Completed Pull Request tags for each Git repository with changes for the current and previous release.
- Screen shots of the Code Review Quality should be stored in the projects SharePoint document library in a location defined by team procedures and included in the Monthly Status Review data.
- The data will be analyzed by Development Manager and the Code Review Maturity Level identified for the monthly status review for the previous and current release.
Data Integrity
- Pull Request Tag data is collected during the Review Code activity.
- SonarQube data is collected during the Integrate Changes activity.
- The Development Manager will evaluate the data integrity during the analysis of the data.
Analysis Method
- Analyze each of the SonarQube Activities defined above and compare them to the tags in the list of completed pull requests for the release.
- Analysis should look to correlate changes in activities to pull request tags as the dates of changes should correspond with the pull request completion date.
- Identify the teams maturity level according to the defined values, preform root cause analysis on any data integrity problems, and preform root cause analysis on why the team maturity for preforming code reviews isn’t improving or is regressing.
Reporting Distribution and Frequency
See InnovaSystem’s Process Guidance RA for the following activities to determine which roles are included in the communication of the measurement data: