User Story Cycle Time
(Metric) for Tier: Release
Organizational Goal
Velocity: Ensure projects can meet their estimated commitments.
Quantitative Goal
User Story Cycle Time is a measure of the time it takes for a team to complete User Stories once they begin actively working on them. This measure will help teams plan, spot variations in efficiency, and identify potential process issues.
Visual Display of Measure
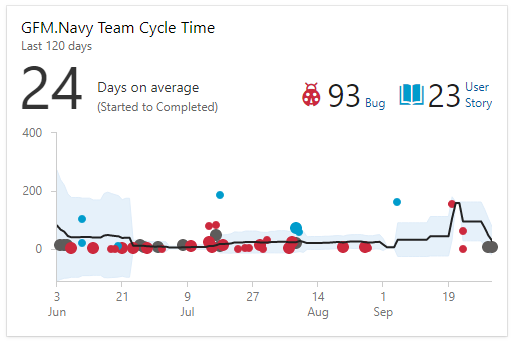
Metric Description
This metric shows the average time it takes for User Stories to move from in progress or active to completed or closed for the configured time period. It also shows a scatter plot of work item cycle time, with and average line, and work item counts.
- Cycle Time is defined as the time it takes for a work item to go from In Progress to completed.
- Cycle Time moving average is the trend line on the scatter plot.
- Cycle Time standard deviation is the gray band that encompasses the moving average on the scatter plot.
Lower cycle times indicate a higher level of user story throughput. This can help teams predict when user stories will be completed on average. The predictability improves as variability in the size of stories is reduced.
Collection Method, Frequency, and Storage
Azure DevOps will automatically collect, calculate, and aggregate the data in real time when users update work item state for the configured work items.
Data Integrity
User stories cycle times data are updated as state change occur in activities such as Sprint, Integrate Changes, and Verify User Stories and Bugs.
Analysis Method
Consult the links in the SEE ALSO section for additional information on how the data is analyzed to product the metric.
Reporting Distribution and Frequency
Metric should be displayed on a team dashboard in Azure DevOps and used in Plan a Release as an estimation tool and Monitor Release as a forecast method.