Storytelling Session
(Activity) for Tier: Data Analytics
PURPOSE
To provide insights into the data using plain-English stories. To guide data scientists in understanding the data in a way that anyone can understand.
WHEN
After Visualization Design
PARTICIPATING ROLES
- ACCOUNTABLE
- RESPONSIBLE
INPUTS
- Premises and Conclusion(s) in the form of Visuals (e.g. Dashboard, Presentation, Storyboards, or GUI).
Todo
need to be define work products for all inputs.
ENTRY CRITERIA
- Describe any required pre-conditions that must exist before beginning this activity.
SUB-ACTIVITIES
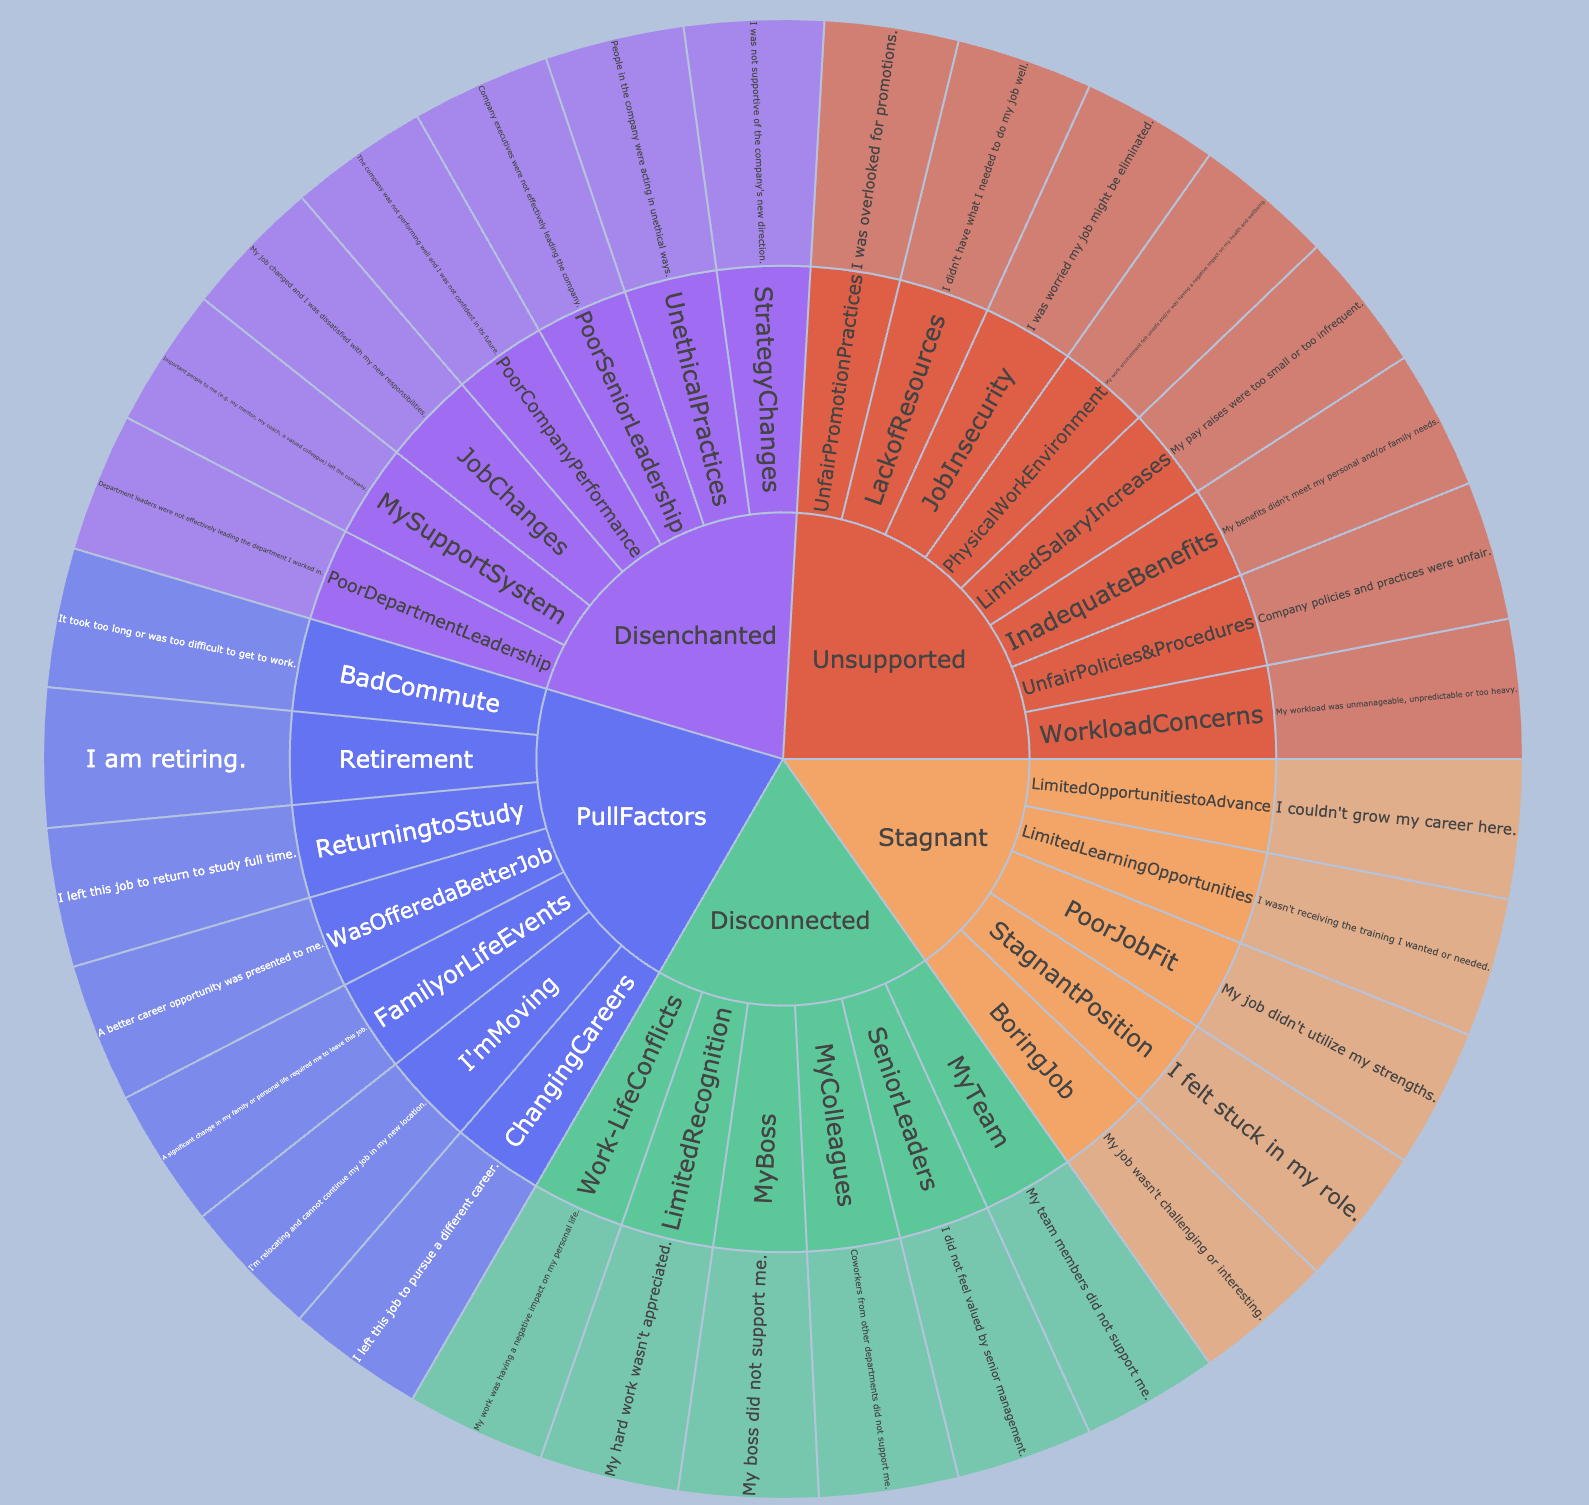
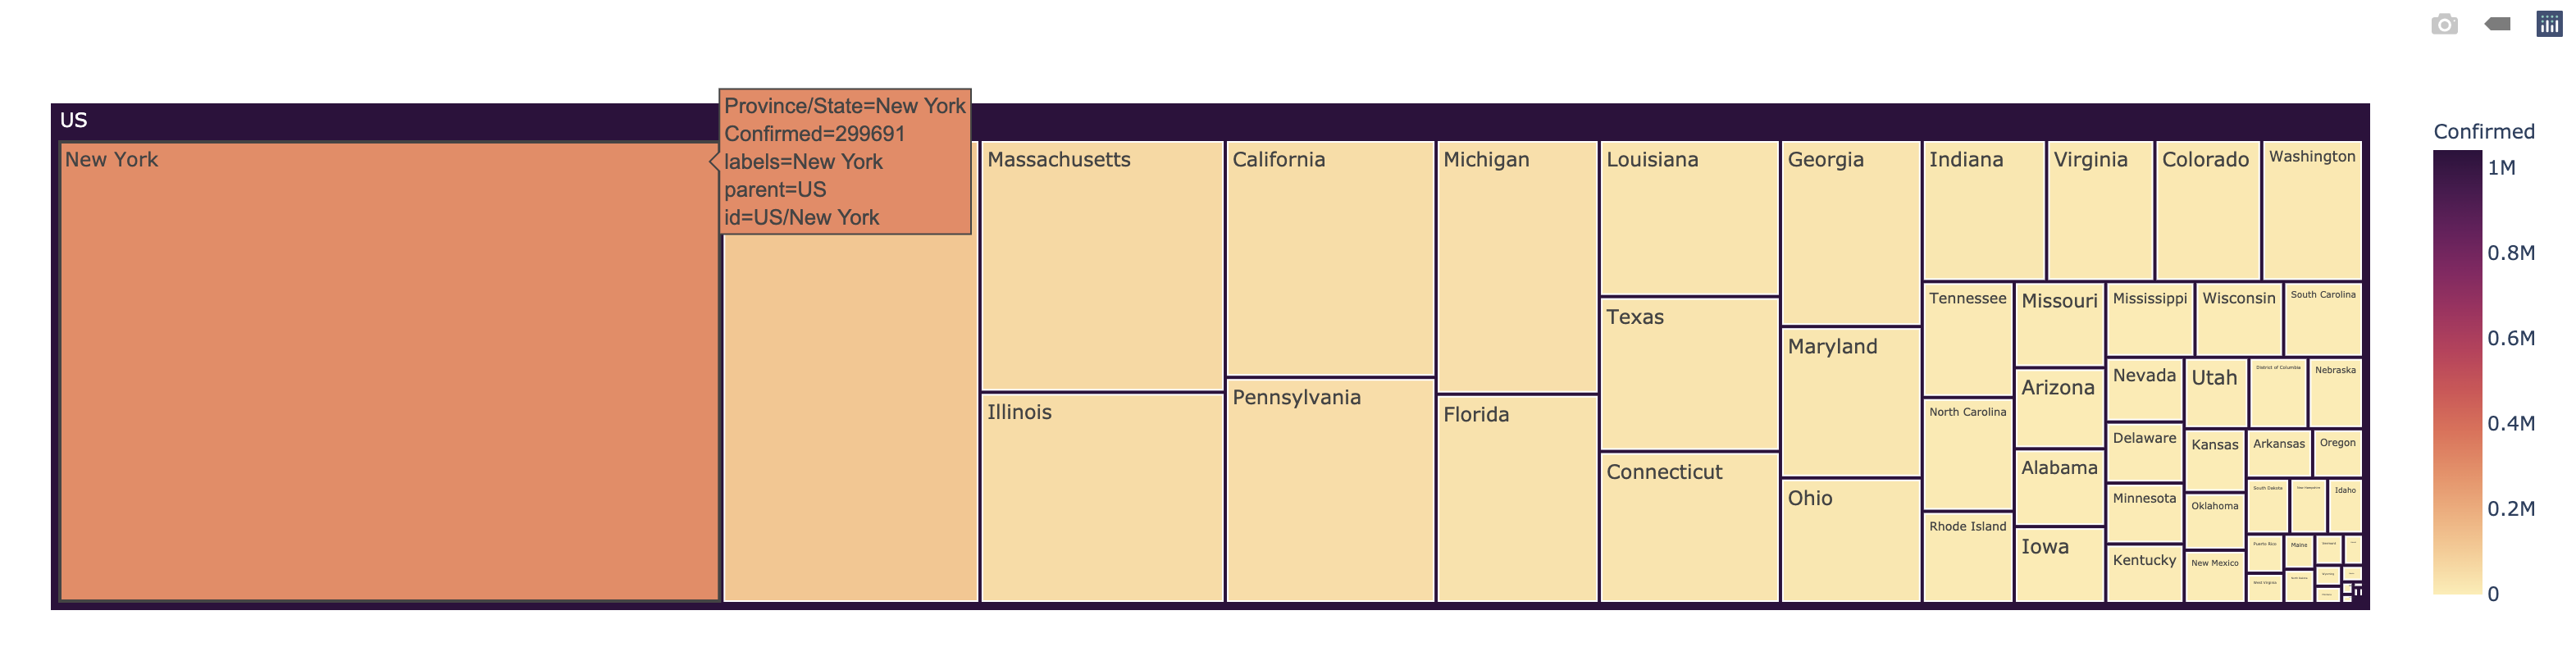
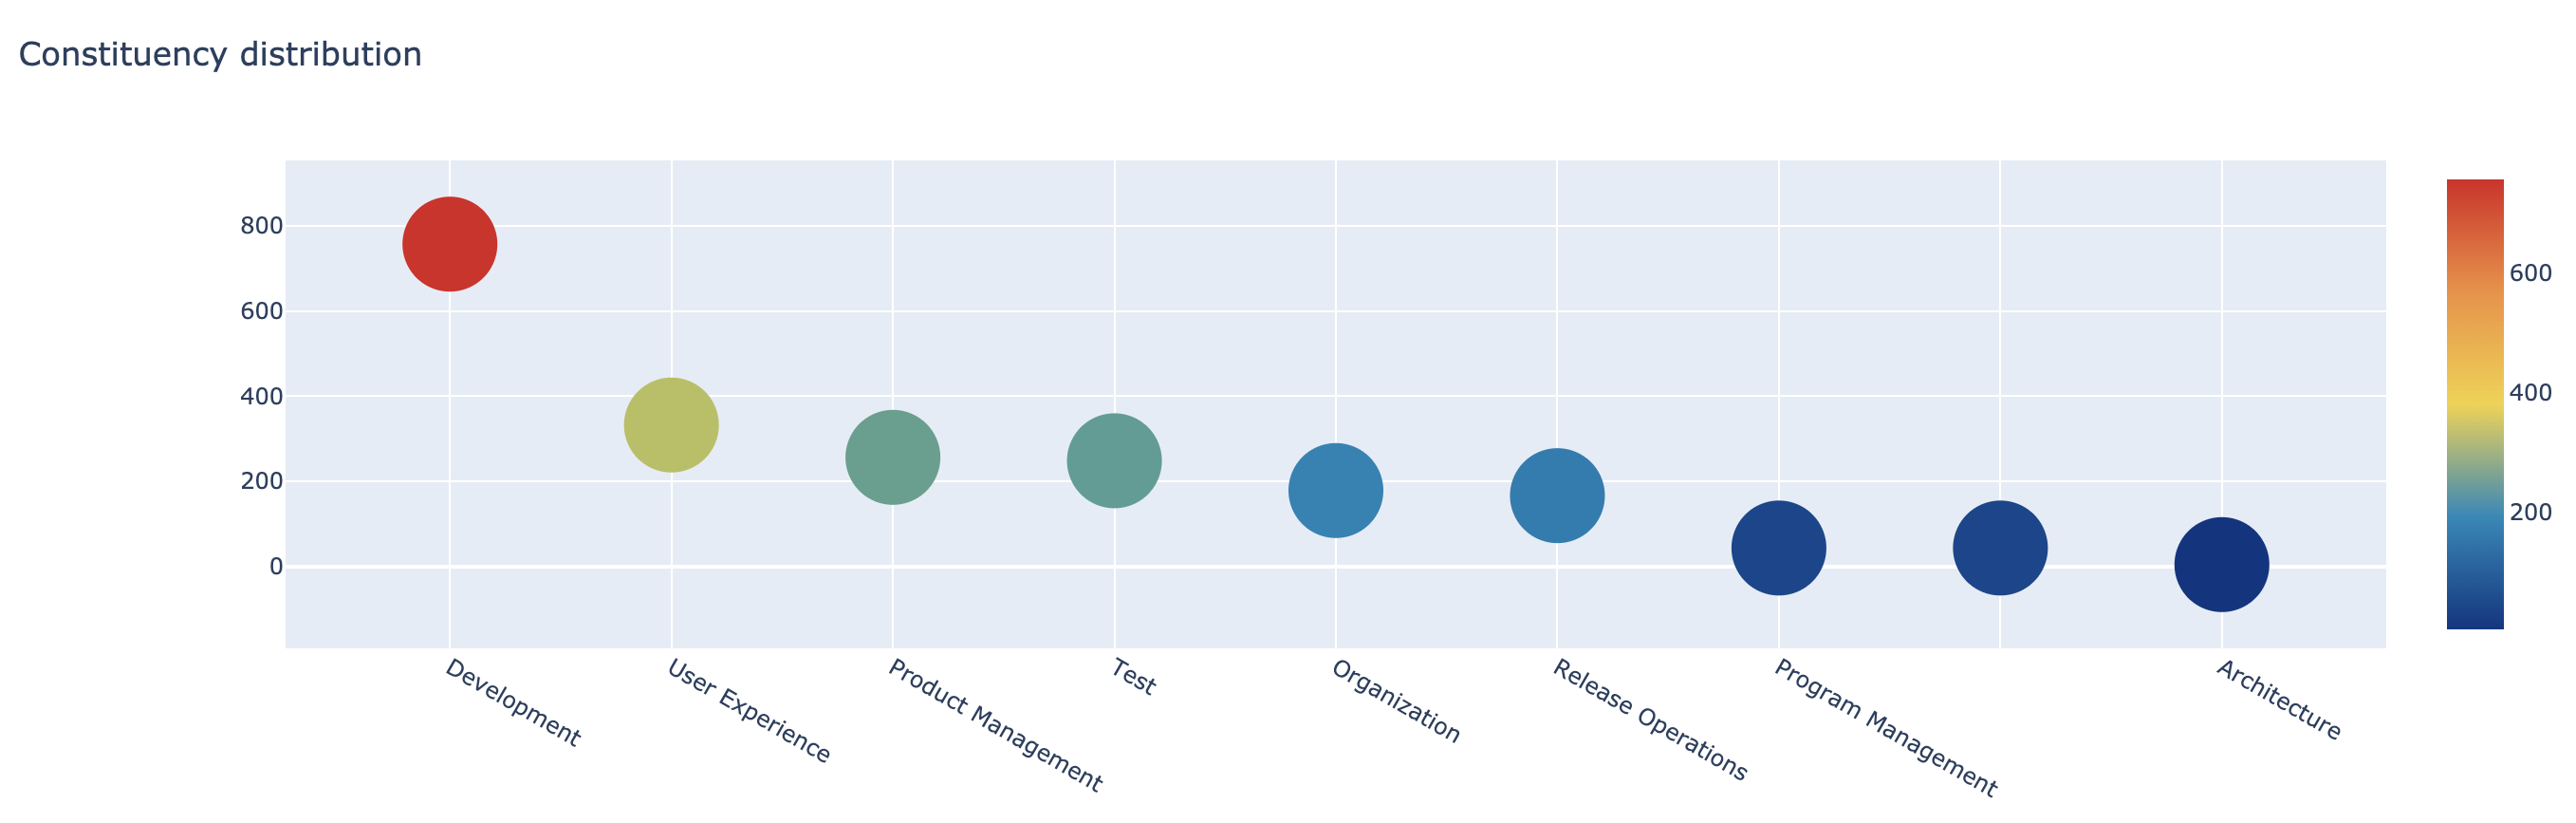
- Data Scientists present a story about what they learned during the sprint. The story should be compelling, taking the audience on a journey. This narrative is key to conveying insights, with the data and visuals being important proof points.
- Visuals are presented if they exist. The audience understands metrics, trends and patterns better with visuals such as graphs, charts, GUI, etc.
EXIT CRITERIA
- Story has been shared and discussed.
- Questions have been discussed and recorded.
.png)